Here are the steps in creating a dashboard in Grafana:
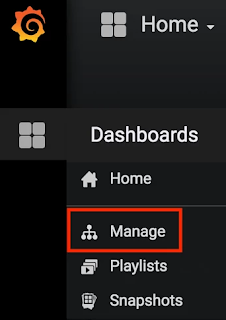
1. On the left panel, hover on the "Dashboards" icon.
2. Select "Manage"
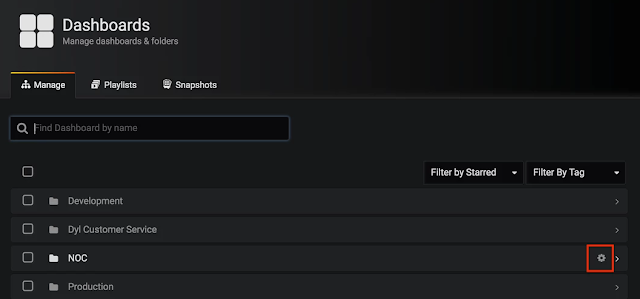
3. On the folder that you're allowed to add a dashboard, click the "Settings" icon.
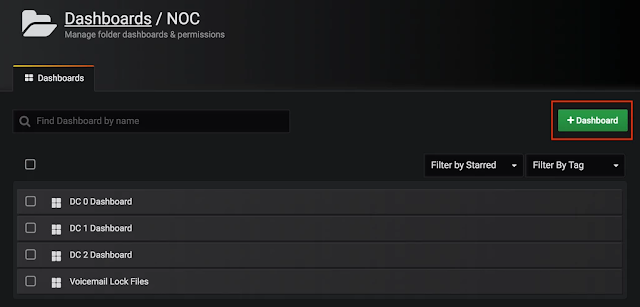
4. Click the "+ Dashboard" button.
1. On the left panel, hover on the "Dashboards" icon.
2. Select "Manage"
3. On the folder that you're allowed to add a dashboard, click the "Settings" icon.
4. Click the "+ Dashboard" button.
Comments